Dissolution Simulation
In this tutorial, the Al-Cu alloy is taken as an example to demonstrate a dissolution simulation. The GUI of dissolution is discussed in Section Settings in Particle Dissolution Simulation. In general, user should follow the following steps to carry out a dissolution simulation:
Set up Initial Condition for Dissolution Simulation
The particle is assumed to be spherical and have a radius of 3 µm, and its volume fraction is 0.008. The overall composition of the system is 98.45Al-1.55Cu (at%). The simulation box is digitized to 100 grids.
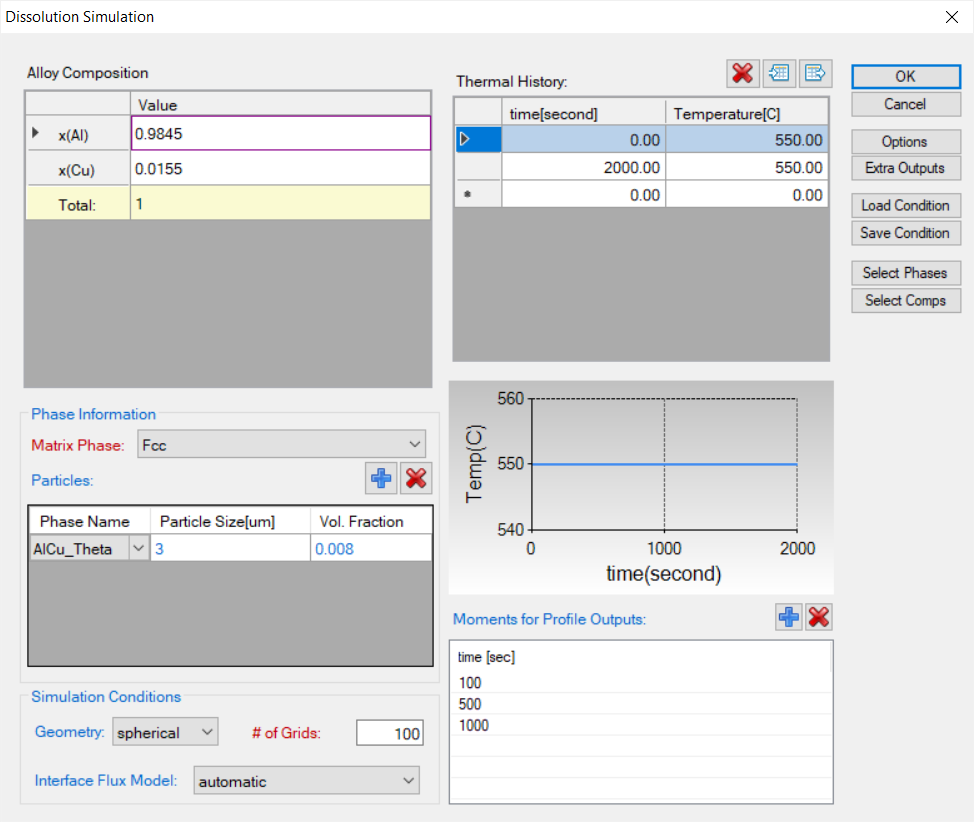
To set the above conditions in PanDiffusion, click ![]() on the Toolbar or from the menu "PanDiffusion → Dissolution Simulation", a popup window as shown in Figure 1 will allow user to set up calculation conditions. In “Alloy Composition” section, the overall composition of Al-Cu alloy is set to 98.45Al-1.55Cu (at%). In “Phase Information” section, set “Matrix Phase” as Fcc. In “Particles” subsection, click
on the Toolbar or from the menu "PanDiffusion → Dissolution Simulation", a popup window as shown in Figure 1 will allow user to set up calculation conditions. In “Alloy Composition” section, the overall composition of Al-Cu alloy is set to 98.45Al-1.55Cu (at%). In “Phase Information” section, set “Matrix Phase” as Fcc. In “Particles” subsection, click ![]() bottom to add a particle, set “Phase Name” as AlCu_Theta, set “Particle Size” as 3 µm, and set “Vol. Fraction” as 0.008. In “Simulation Conditions” Section, set “Geometry” as spherical, and set “# of Grids” as 100. In “Thermal History” section, temperature is set as 550°C, and heat treatment duration is set as 2000 seconds.
bottom to add a particle, set “Phase Name” as AlCu_Theta, set “Particle Size” as 3 µm, and set “Vol. Fraction” as 0.008. In “Simulation Conditions” Section, set “Geometry” as spherical, and set “# of Grids” as 100. In “Thermal History” section, temperature is set as 550°C, and heat treatment duration is set as 2000 seconds.
Add additional intermediate outputs at 100s, 500s and 1000s in the section “Moments for Profile Outputs”, then click “OK” to start the calculation.
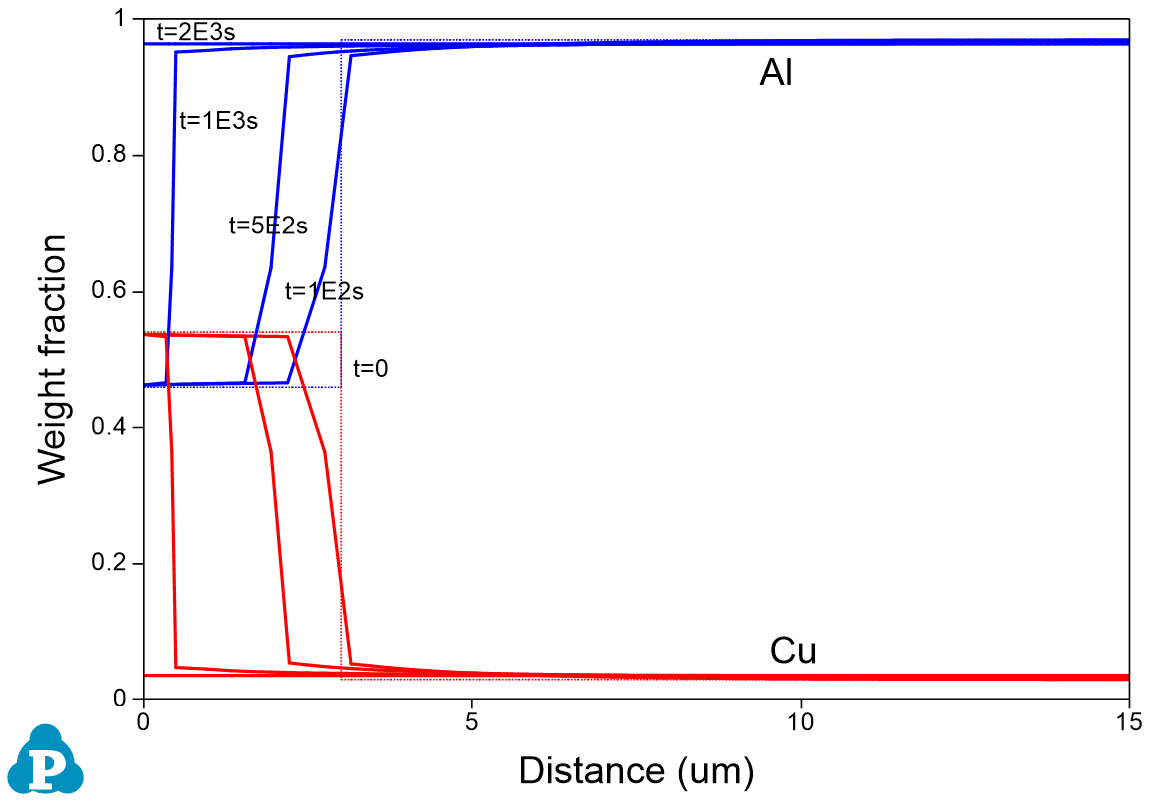
Simulation Results
Click OK button in Figure 1 to start the simulation after the initial condition is set properly. The simulation results are displayed in Figure 2 and Figure 3. Please refer to Section Graph of this user manual to add text, legend, and change the appearance of the figure. Figure 2 shows the particle size change with time, from 3 µm (radius) at beginning to zero after annealing at 550 °C for ~1000 seconds. Figure 3 shows diffusion between particle and matrix and the composition profiles at 0s, 100s, 500s, 1000s, and 2000s. It is seen from Figure 6.15 that the particles are completely dissolved after annealing for 2000s.